prometheus监控mysql

prometheus监控mysql

介绍

本文使用的是官方的mysqld_exporter.github地址:mysqld_exporter

mysql版本需要在5.6版本或以上

mysqld_exporter提供很多监控项(具体参考github项目介绍).如果需要开启一个监控项,在启动mysqld_exporter时,携带以下命令:

1
--collect.key

如果需要关闭某个监控项.携带以下命令:

1
--no-collect.key

如果mysqld_exporter的版本小于0.10.0,命令有些变化,双横杠变成单横杠,使用-collect.key 或者-collect.key=True|false


mysqld_exporter安装

安装方式很简单,.下面是一个Ansible脚本以供参考

1
2
3
4
5
6
7
8
9
10
11
12
13
14
15
16
17
18
19
20
21
22
23
24
25
26
27
28
29
30
31
32
33
34
35
36
37
38
- hosts: mysql-prod
remote_user: work
become: yes
gather_facts: no
tasks:
- name: 检查mysqld_exporter是否已经安装
systemd:
name: mysqld_exporter
state: started
ignore_errors: true
register: result

- name: 安装mysqld_exporter
unarchive:
src: http://repo.doweidu.com/prometheus/mysqld_exporter-0.12.1.linux-amd64.tar.gz
dest: /home/work/
remote_src: yes
when: result is failed

- name: 重命名
command: mv /home/work/mysqld_exporter-0.12.1.linux-amd64 /home/work/mysqld_exporter
when: result is failed

- name: 拷贝到/usr/local下
shell: cp -r /home/work/mysqld_exporter /usr/local/
when: result is failed

- name: 拷贝配置文件到/usr/local/mysqld_exporter下
copy: src=files/localhost_db.cnf dest=/usr/local/mysqld_exporter/
when: result is failed

- name: 拷贝systemd文件
copy: src=files/mysqld_exporter.service dest=/usr/lib/systemd/system/mysqld_exporter.service
when: result is failed

- name: 启动mysqld_exporter
systemd: name=mysqld_exporter state=started enabled=yes
when: result is failed

这里需要准备一个localhost_db.cnf配置文件.内容如下

1
2
3
4
5
[client]
host=127.0.0.1 #mysql服务器地址
#port= #mysql端口,默认为3306,如果端口是默认3306,可以删掉这行
user=zabbix #mysql用于监控的账号
password=xxxxxx #密码

mysqld_exporter启动脚本

1
2
3
4
5
6
7
8
9
10
11
12
13
[Unit]
Description=mysqld_exporter
Documentation=https://prometheus.io/
After=network.target

[Service]
Type=simple
User=root
ExecStart=/usr/local/mysqld_exporter/mysqld_exporter --config.my-cnf=/usr/local/mysqld_exporter/localhost_db.cnf
Restart=on-failure

[Install]
WantedBy=multi-user.target

Ansible脚本执行完毕后,就可以通过IP:9104来访问mysql的Metrics

为了监控到主机的情况.此时还需要部署node_exporter客户端.关于Node_exporter我在另一篇笔记中再详细介绍


prometheus配置

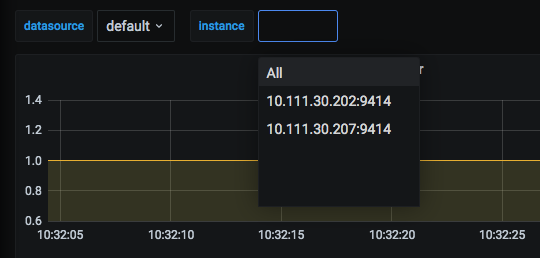
由于mysqld_exporter没有任何监控项能获取到mysql服务器的主机名.所以将数据展示到grafana时,只能通过IP去查看监控图表.这非常的不方便.比如下面截图中,当mysql服务器数量较多时,很难知道IP地址对应的是具体哪台服务器:

image-20201126103328877

此时,就需要在prometheus配置文件中,将每个mysql服务器添加labels,给服务器打上主机名和组名的标签

1
2
3
4
5
6
7
8
9
10
11
12
13
14
- job_name: 'aliyun-mysql-exporter'
static_configs:
- targets:
- '10.111.200.176:9104'
labels:
hostname: 'mg-goodscenter-mysql-master'
group: 'mg-mysql'

- targets: ['10.111.50.39:9104']
labels:
hostname: 'mg-msg-mysql-master'
group: 'mg-mysql'

......以下省略......

grafana dashboard

下载dashboard: https://grafana.com/grafana/dashboards/7362

或者直接在grafana中添加7362的dashboard

原生的dashboard只有一个instance的变量.为了添加主机名,更好的区分和展示监控效果,需要做一些修改.
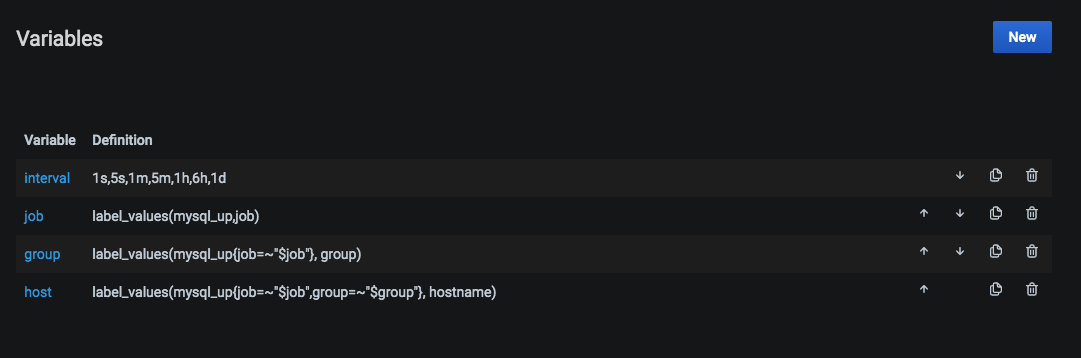
1.定义变量:

  • job变量:

    • name:job
    • label: job

    • query: label_values(mysql_up,job)

  • group变量:

    • name: group
    • label:主机组
    • Query:label_values(mysql_up{job=~”$job”}, group)

2.修改变量

将host变量修改为:

name: host

label: 主机名

query:label_values(mysql_up{job=~”$job”,group=~”$group”}, hostname)

3.变量页面最终设置如下:

image-20201126105202201

接着,将当前的dashboard的json文件导出.复制下面的json文件

image-20201126105345163

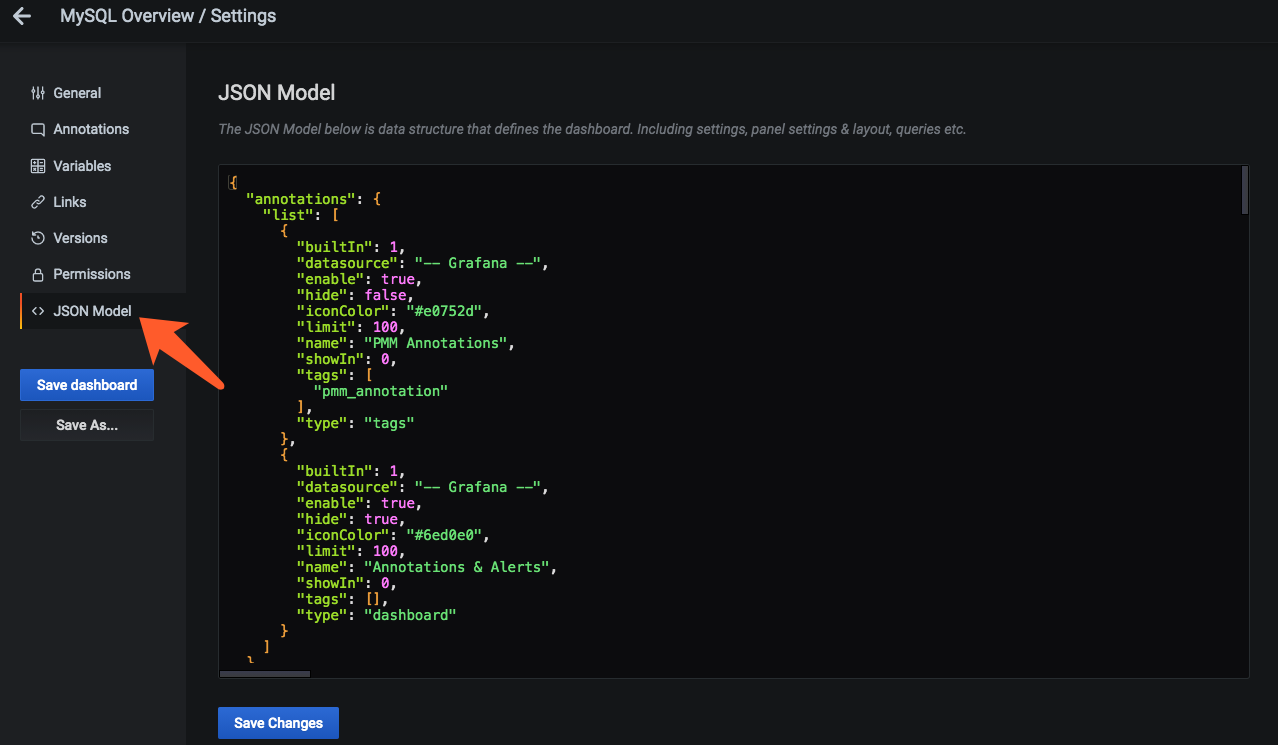
将文件中的instance=~全部替换为hostname=~.然后复制回去,点击Save Changes

此时,可以通过主机组和主机名筛选具体的mysql服务器.
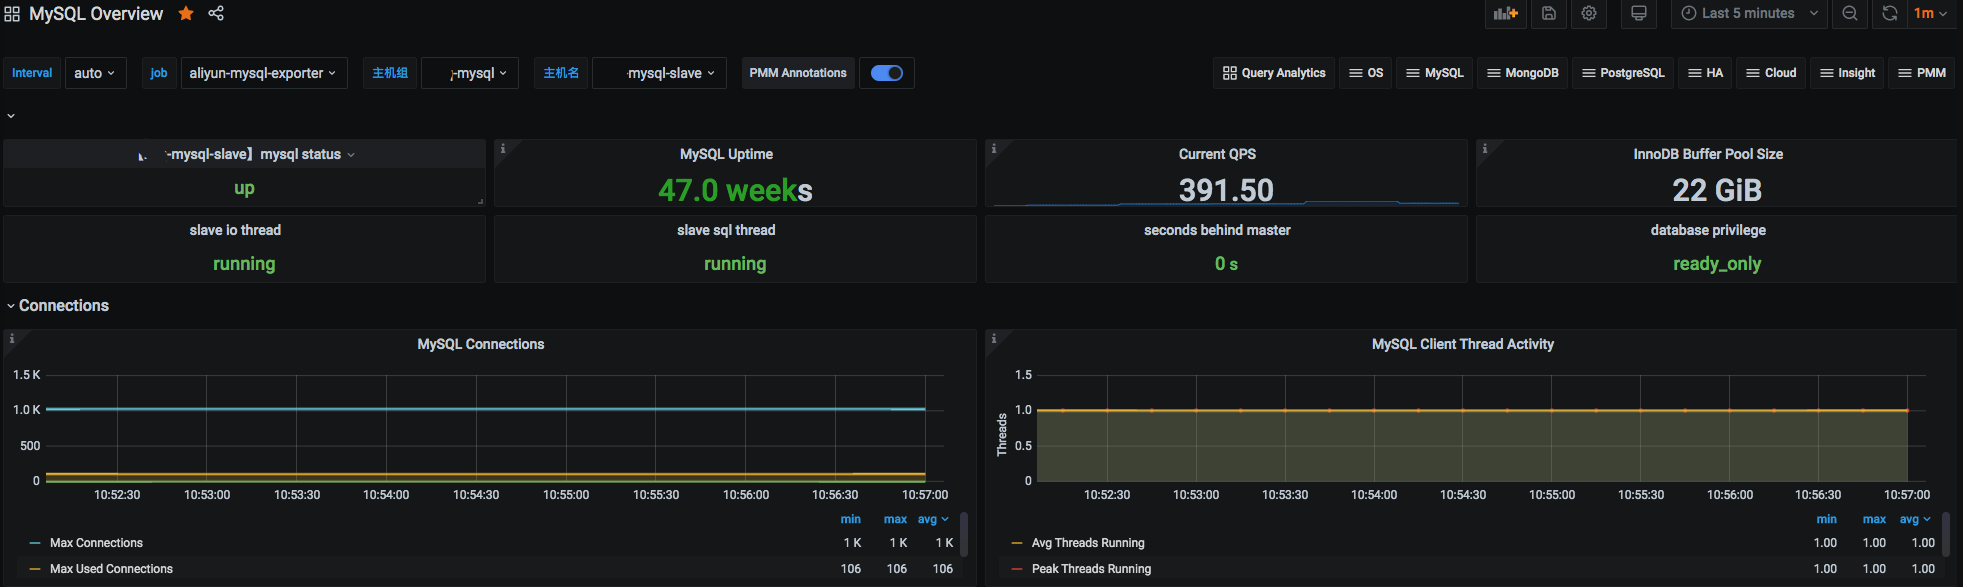
image-20210329171207919

image-20210329171842731

别忘记保存dashboard


rules告警规则

1
2
3
4
5
6
7
8
9
10
11
12
13
14
15
16
17
18
19
20
21
22
23
24
25
26
27
28
29
30
31
32
33
34
35
36
37
38
39
40
41
42
43
44
45
46
47
48
49
50
51
52
53
54
55
56
57
58
59
60
61
62
63
64
65
66
67
68
69
70
71
72
73
74
75
76
77
78
79
80
81
82
83
84
85
86
87
88
89
90
91
92
93
94
95
96
97
98
99
100
101
102
103
104
105
106
107
108
109
110
111
112
113
114
115
116
117
118
119
120
121
122
123
124
125
126
127
128
129
130
131
132
133
134
135
136
137
138
139
140
141
142
143
144
145
146
147
148
149
150
151
152
153
154
155
156
157
158
159
160
161
162
163
164
165
166
167
168
169
170
171
172
173
174
175
176
177
178
179
180
181
182
183
184
185
186
187
188
189
190
191
192
193
194
195
groups:
- name: MySQLStatsAlert
rules:
- alert: MySQL is down
expr: mysql_up == 0
for: 1m
labels:
severity: critical
annotations:
summary: "Instance {{ $labels.instance }} MySQL is down"
description: "MySQL database is down. This requires immediate action!"
- alert: open files high
expr: mysql_global_status_innodb_num_open_files > (mysql_global_variables_open_files_limit) * 0.75
for: 1m
labels:
severity: warning
annotations:
summary: "Instance {{ $labels.instance }} open files high"
description: "Open files is high. Please consider increasing open_files_limit."
- alert: Read buffer size is bigger than max. allowed packet size
expr: mysql_global_variables_read_buffer_size > mysql_global_variables_slave_max_allowed_packet
for: 1m
labels:
severity: warning
annotations:
summary: "Instance {{ $labels.instance }} Read buffer size is bigger than max. allowed packet size"
description: "Read buffer size (read_buffer_size) is bigger than max. allowed packet size (max_allowed_packet).This can break your replication."
- alert: Sort buffer possibly missconfigured
expr: mysql_global_variables_innodb_sort_buffer_size <256*1024 or mysql_global_variables_read_buffer_size > 4*1024*1024
for: 1m
labels:
severity: warning
annotations:
summary: "Instance {{ $labels.instance }} Sort buffer possibly missconfigured"
description: "Sort buffer size is either too big or too small. A good value for sort_buffer_size is between 256k and 4M."
- alert: Thread stack size is too small
expr: mysql_global_variables_thread_stack <196608
for: 1m
labels:
severity: warning
annotations:
summary: "Instance {{ $labels.instance }} Thread stack size is too small"
description: "Thread stack size is too small. This can cause problems when you use Stored Language constructs for example. A typical is 256k for thread_stack_size."
- alert: Used more than 80% of max connections limited
expr: mysql_global_status_max_used_connections > mysql_global_variables_max_connections * 0.8
for: 1m
labels:
severity: warning
annotations:
summary: "Instance {{ $labels.instance }} Used more than 80% of max connections limited"
description: "Used more than 80% of max connections limited"
- alert: InnoDB Force Recovery is enabled
expr: mysql_global_variables_innodb_force_recovery != 0
for: 1m
labels:
severity: warning
annotations:
summary: "Instance {{ $labels.instance }} InnoDB Force Recovery is enabled"
description: "InnoDB Force Recovery is enabled. This mode should be used for data recovery purposes only. It prohibits writing to the data."
- alert: InnoDB Log File size is too small
expr: mysql_global_variables_innodb_log_file_size < 16777216
for: 1m
labels:
severity: warning
annotations:
summary: "Instance {{ $labels.instance }} InnoDB Log File size is too small"
description: "The InnoDB Log File size is possibly too small. Choosing a small InnoDB Log File size can have significant performance impacts."
- alert: InnoDB Flush Log at Transaction Commit
expr: mysql_global_variables_innodb_flush_log_at_trx_commit != 1
for: 1m
labels:
severity: warning
annotations:
summary: "Instance {{ $labels.instance }} InnoDB Flush Log at Transaction Commit"
description: "InnoDB Flush Log at Transaction Commit is set to a values != 1. This can lead to a loss of commited transactions in case of a power failure."
- alert: Table definition cache too small
expr: mysql_global_status_open_table_definitions > mysql_global_variables_table_definition_cache
for: 1m
labels:
severity: page
annotations:
summary: "Instance {{ $labels.instance }} Table definition cache too small"
description: "Your Table Definition Cache is possibly too small. If it is much too small this can have significant performance impacts!"
- alert: Table open cache too small
expr: mysql_global_status_open_tables >mysql_global_variables_table_open_cache * 99/100
for: 1m
labels:
severity: page
annotations:
summary: "Instance {{ $labels.instance }} Table open cache too small"
description: "Your Table Open Cache is possibly too small (old name Table Cache). If it is much too small this can have significant performance impacts!"
- alert: Thread stack size is possibly too small
expr: mysql_global_variables_thread_stack < 262144
for: 1m
labels:
severity: page
annotations:
summary: "Instance {{ $labels.instance }} Thread stack size is possibly too small"
description: "Thread stack size is possibly too small. This can cause problems when you use Stored Language constructs for example. A typical is 256k for thread_stack_size."
- alert: InnoDB Buffer Pool Instances is too small
expr: mysql_global_variables_innodb_buffer_pool_instances == 1
for: 1m
labels:
severity: page
annotations:
summary: "Instance {{ $labels.instance }} InnoDB Buffer Pool Instances is too small"
description: "If you are using MySQL 5.5 and higher you should use several InnoDB Buffer Pool Instances for performance reasons. Some rules are: InnoDB Buffer Pool Instance should be at least 1 Gbyte in size. InnoDB Buffer Pool Instances you can set equal to the number of cores of your machine."
- alert: InnoDB Plugin is enabled
expr: mysql_global_variables_ignore_builtin_innodb == 1
for: 1m
labels:
severity: page
annotations:
summary: "Instance {{ $labels.instance }} InnoDB Plugin is enabled"
description: "InnoDB Plugin is enabled"
- alert: Binary Log is disabled
expr: mysql_global_variables_log_bin != 1
for: 1m
labels:
severity: warning
annotations:
summary: "Instance {{ $labels.instance }} Binary Log is disabled"
description: "Binary Log is disabled. This prohibits you to do Point in Time Recovery (PiTR)."
- alert: Binlog Cache size too small
expr: mysql_global_variables_binlog_cache_size < 1048576
for: 1m
labels:
severity: page
annotations:
summary: "Instance {{ $labels.instance }} Binlog Cache size too small"
description: "Binlog Cache size is possibly to small. A value of 1 Mbyte or higher is OK."
- alert: Binlog Statement Cache size too small
expr: mysql_global_variables_binlog_stmt_cache_size <1048576 and mysql_global_variables_binlog_stmt_cache_size > 0
for: 1m
labels:
severity: page
annotations:
summary: "Instance {{ $labels.instance }} Binlog Statement Cache size too small"
description: "Binlog Statement Cache size is possibly to small. A value of 1 Mbyte or higher is typically OK."
- alert: Binlog Transaction Cache size too small
expr: mysql_global_variables_binlog_cache_size <1048576
for: 1m
labels:
severity: page
annotations:
summary: "Instance {{ $labels.instance }} Binlog Transaction Cache size too small"
description: "Binlog Transaction Cache size is possibly to small. A value of 1 Mbyte or higher is typically OK."
- alert: Sync Binlog is enabled
expr: mysql_global_variables_sync_binlog == 1
for: 1m
labels:
severity: page
annotations:
summary: "Instance {{ $labels.instance }} Sync Binlog is enabled"
description: "Sync Binlog is enabled. This leads to higher data security but on the cost of write performance."
- alert: IO thread stopped
expr: mysql_slave_status_slave_io_running != 1
for: 1m
labels:
severity: critical
annotations:
summary: "Instance {{ $labels.instance }} IO thread stopped"
description: "IO thread has stopped. This is usually because it cannot connect to the Master any more."
- alert: SQL thread stopped
expr: mysql_slave_status_slave_sql_running == 0
for: 1m
labels:
severity: critical
annotations:
summary: "Instance {{ $labels.instance }} SQL thread stopped"
description: "SQL thread has stopped. This is usually because it cannot apply a SQL statement received from the master."
- alert: SQL thread stopped
expr: mysql_slave_status_slave_sql_running != 1
for: 1m
labels:
severity: critical
annotations:
summary: "Instance {{ $labels.instance }} Sync Binlog is enabled"
description: "SQL thread has stopped. This is usually because it cannot apply a SQL statement received from the master."
- alert: Slave lagging behind Master
expr: rate(mysql_slave_status_seconds_behind_master[1m]) >30
for: 1m
labels:
severity: warning
annotations:
summary: "Instance {{ $labels.instance }} Slave lagging behind Master"
description: "Slave is lagging behind Master. Please check if Slave threads are running and if there are some performance issues!"
- alert: Slave is NOT read only(Please ignore this warning indicator.)
expr: mysql_global_variables_read_only != 0
for: 1m
labels:
severity: page
annotations:
summary: "Instance {{ $labels.instance }} Slave is NOT read only"
description: "Slave is NOT set to read only. You can accidentally manipulate data on the slave and get inconsistencies..."

本文标题:prometheus监控mysql

文章作者:Jesse

发布时间:2021年03月10日 - 07:03

最后更新:2021年04月01日 - 21:04

原始链接:https://jesse.top/2021/03/10/prometheus/prometheus监控mysql/

许可协议: 禁止商业用途 转载请保留原文链接及作者。

坚持原创技术分享,您的支持将鼓励我继续创作!