Filebeat+logstash收集Nginx访问日志

Filebeat+logstash收集Nginx访问日志

环境:

Filebeat: 7.0

Logstash:7.0

elasticsearch:7.0


介绍

logstash默认自带了apache标准日志格式的grok正则表达式:

1
2
COMMONAPACHELOG %{IPORHOST:clientip} %{USER:ident} %{NOTSPACE:auth} \[%{HTTPDATE:timestamp}\] "(?:%{WORD:verb} %{NOTSPACE:request}(?: HTTP/%{NUMBER:httpversion})?|%{DATA:rawrequest})" %{NUMBER:response} (?:%{NUMBER:bytes}|-)
COMBINEDAPACHELOG %{COMMONAPACHELOG} %{QS:referrer} %{QS:agent}

对于 nginx 标准日志格式,可以发现只是最后多了一个 $http_x_forwarded_for 变量。所以 nginx 标准日志的 grok 正则定义是:

1
MAINNGINXLOG %{COMBINEDAPACHELOG} %{QS:x_forwarded_for}

如果Nginx日志格式不是标准的日志格式,则需要自行编写grok正则,匹配日志内容.

但是grok正则表达式不容易上手,非常难写.复杂不说,而且logstash使用正则表达式来处理日志格式,其性能也会受到很大的影响.

所以这里推荐另外一种收集方式.

本文档参考博客:https://www.popyone.com/post/13.html

本文档参考书籍:ELK权威指南中文版第二版


json格式的Nginx日志

对 logstash 来说,nginx 日志还有另一种更简便的处理方式。就是自定义日志格式时,通过手工拼写,直接输出成 JSON 格式:

1
2
3
4
5
6
7
8
9
10
11
12
13
14
15
16
17
18
19
log_format json escape=json  '{"@timestamp":"$time_iso8601",'
'"@source":"$server_addr",'
'"hostname":"$hostname",'
'"ip":"$http_x_forwarded_for",'
'"client":"$remote_addr",'
'"request_method":"$request_method",'
'"scheme":"$scheme",'
'"domain":"$server_name",'
'"client_host":"$host",'
'"referer":"$http_referer",'
'"request":"$request_uri",'
'"args":"$args",'
'"size":$body_bytes_sent,'
'"status": $status,'
'"responsetime":$request_time,'
'"upstreamtime":"$upstream_response_time",'
'"upstreamaddr":"$upstream_addr",'
'"http_user_agent":"$http_user_agent"'
'}';

escape=json 参数,在配置日志格式时加上此参数可以不转义变量内容

nginx虚拟主机的access_log应用了Json的格式后,日志格式自动转换成了json格式了

1
{"@timestamp":"2019-01-31T11:26:48+08:00","@source":"192.168.12.200","hostname":"proxy.server","ip":"","client":"183.3.239.170","request_method":"GET","scheme":"http","domain":"www.51hangyu.com","referer":"http://www.51hangyu.com/chat","request":"/static/static/css/main.97f6b853.css","args":"","size":460413,"status": 200,"responsetime":0.108,"upstreamtime":"0.002","upstreamaddr":"192.168.12.15:80","http_user_agent":"Mozilla/5.0 (compatible; MSIE 9.0; Windows NT 6.1; Trident/5.0)"}

这样一来在客户端就自动转换成了json格式,无需logstash通过正则去过滤和匹配日志内容,大大提高logstash的收集性能


Filebeat配置

filebeat.yml配置如下:

1
2
3
4
5
6
7
8
9
10
11
12
13
14
15
16
17
18
19
20
21
22
23
24
25
26
- type: log

# Change to true to enable this input configuration.
enabled: true

# Paths that should be crawled and fetched. Glob based paths.
paths:
- /data/logs/nginx/hsq_openapi_beta.access.log

#默认这个值是FALSE的,也就是我们的json日志解析后会被放在json键上。设为TRUE,所有的keys就会被放到根节点
json.keys_under_root: true

#是否要覆盖原有的key,这是关键配置,将keys_under_root设为TRUE后,再将overwrite_keys也设为TRUE,就能把filebeat默认的key值给覆盖了
json.overwrite_keys: true
exclude_lines: ['HEAD'] #排除HEAD访问日志,因为HEAD是阿里云SLB的健康检查访问,而且没有外网IP,所有不需要上传
json.message_key: request_method #HEAD是request_mothod的字段值,所以需要指定字段名
#fields字段用于打标签和索引,在logstash里判断日志来源
fields:
type: nginx-openapi
project: msf
level: access

---output配置,将日志输出到logstash-----
output.logstash:
# The Logstash hosts
hosts: ["172.16.20.107:5044"]

logstash配置

在logstash的con.d下新建一个Nginx_access的配置文件

1
[root@idc-function-elk07 elasticsearch]# mkdir /etc/logstash/conf.d/nginx_access.conf

配置文件内容如下:

1
2
3
4
5
6
7
8
9
10
11
12
13
14
15
16
17
18
19
20
21
22
23
24
25
26
27
28
29
30
31
32
33
34
35
36
37
38
39
40
41
42
43
44
45
46
47
48
49
50
[root@idc-function-elk07 elasticsearch]# cat /etc/logstash/conf.d/nginx_access.conf
input {
beats {
port => 5044
codec => json
client_inactivity_timeout => 600
}
}
filter {
if "openapi-nginx-access" in [tags] {
date {
match => [ "timestamp" ,"dd/MMM/yyyy:HH:mm:ss Z" ]
target => "@timestamp"
}

mutate {
remove_field => "timestamp"
}

geoip {
source => "ip"
target => "geoip"
database => "/etc/logstash/GeoLite2/GeoLite2-City.mmdb"
add_field => ["[geoip][coordinates]","%{[geoip][longitude]}"]
add_field => ["[geoip][coordinates]","%{[geoip][latitude]}"]
}

mutate {
remove_field => "geoip.continent_code"
remove_field => "geoip.country_code2"
remove_field => "geoip.country_code3"
convert => [ "[geoip][coordinates]","float" ]
convert => [ "status","integer" ]
convert => [ "size","integer" ]
convert => [ "upstreatime","float" ]
}

}
}
output {
elasticsearch {
hosts => ["172.16.20.101:9200","172.16.20.110:9200","172.16.20.107:9200","172.16.20.108:9200","172.16.20.102:9200","172.16.20.103:9200","172.16.20.104:9200","172.16.20.105:9200","172.16.20.106:9200","172.16.20.109:9200"]
index => "logstash-%{[fields][project]}-%{[fields][type]}-%{[fields][level]}-%{+YYYY.MM.dd}"
user => "elastic"
password => "password"
#flush_size => 20000
#idle_flush_time => 10
sniffing => true
template_overwrite => true
}

建议logstash先将日志输出到控制台测试,确定无误后再输出到es.输出到控制台只需要将output字段修改为:

1
2
> output {stdout {}}
>

验证

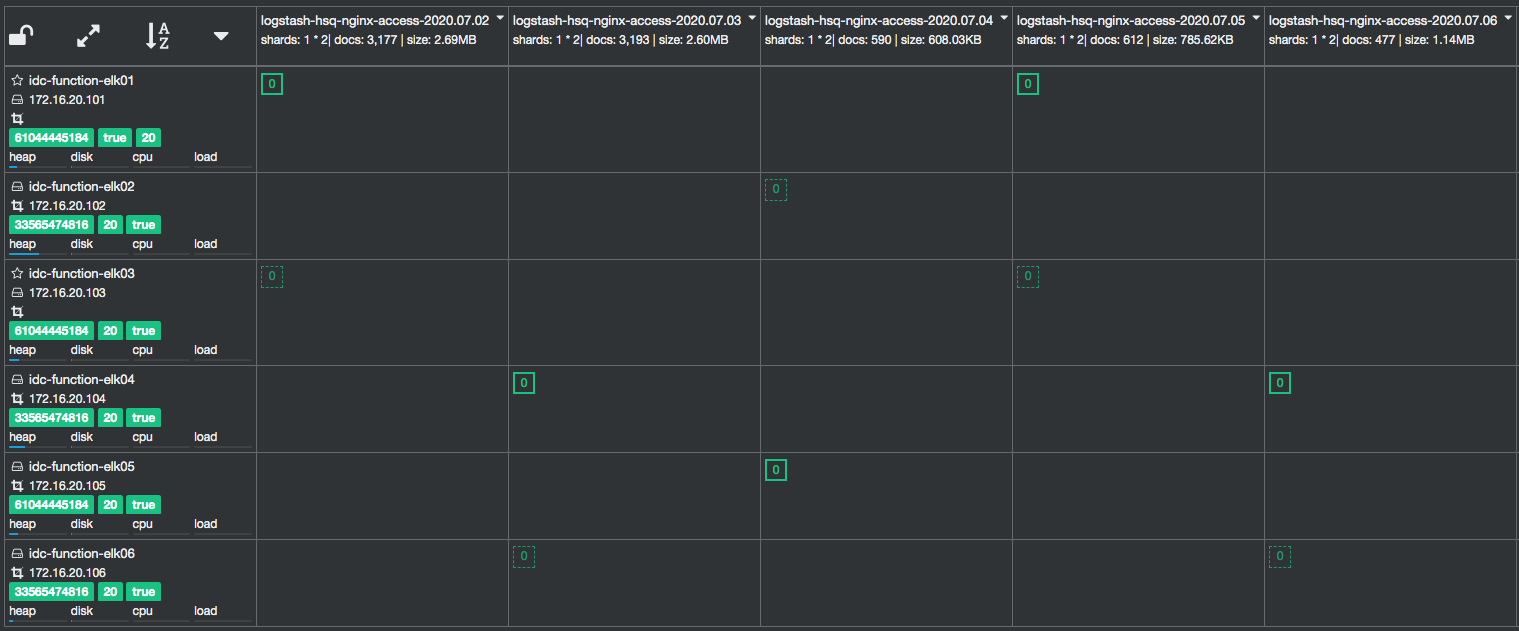
打开es集群的http界面,可以看到产生了索引分片

image-20200706112236216

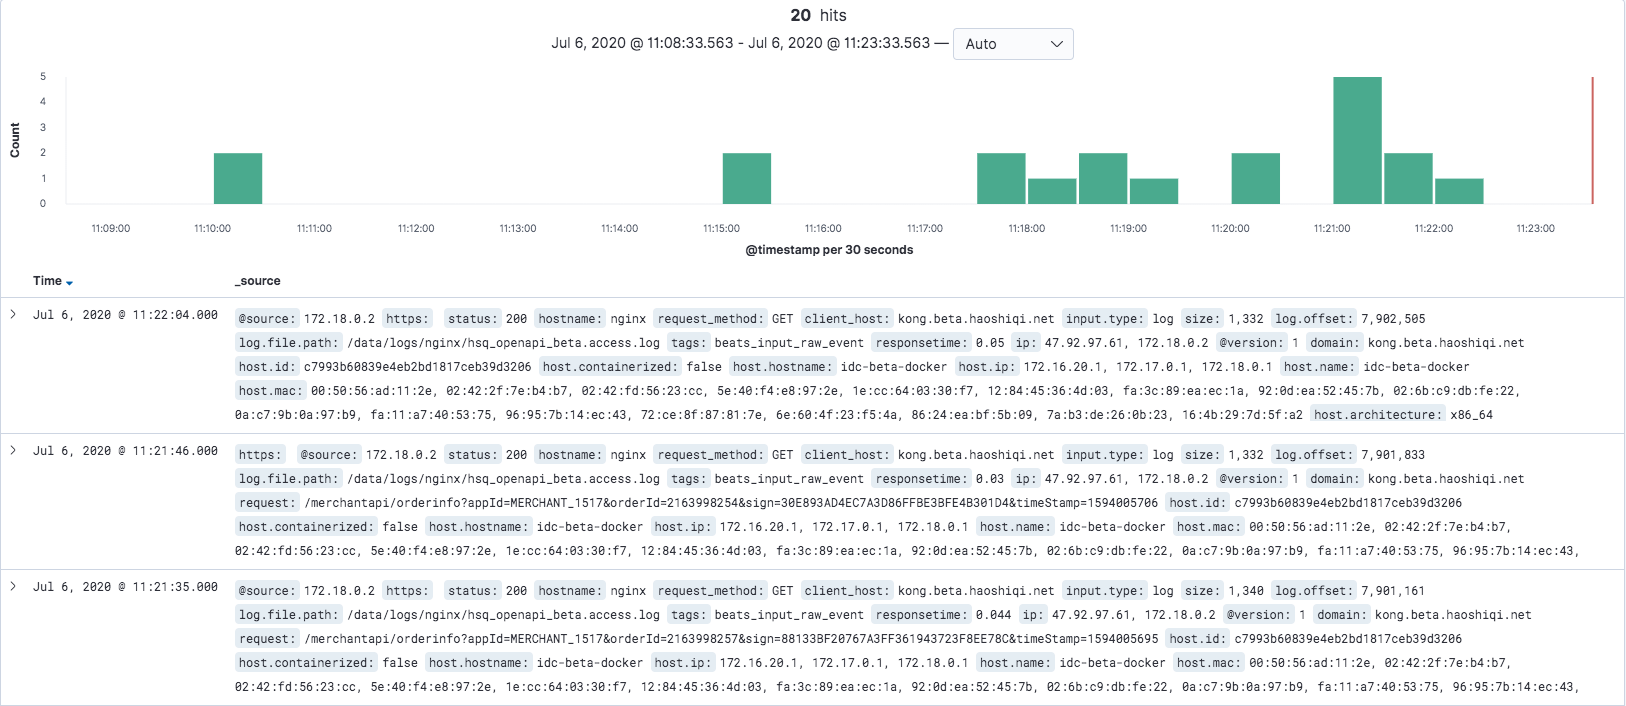
打开kibana配置了logstash-hsq-nginx-access-*的索引以后,可以看到展示的日志:

image-20200706112436147


多个http_x_forwarded_fors上游IP的Nginx访问日志

iqg业务的Nginx经过了2层代理(阿里云SLB—–>Kong—->本地Nginx).所以上游IP有2个,使用json格式转换后,Nginx的访问日志内容如下:

1
{"@timestamp":"2020-08-14T03:15:38+08:00","@source":"10.111.10.35","hostname":"iqg-new1","ip":"183.192.43.174, 100.117.85.32","client":"10.111.30.194","request_method":"GET","scheme":"http","domain":"api.v4.iqianggou.com","client_host":"v4.api.iqg-new1","referer":"","request":"/open/user/clientupload?......}

可以看到IP字段包含了用户真实IP和阿里云SLB的IP.这样的访问日志上传到Logstash后,geoip模块无法处理IP字段.所以需要在logstash中解析和处理IP字段,

但是还有一个更好的办法,不需要logstash去单独处理,减少logstash的负担.可以在nginx本地将处理IP字段.

在nginx.conf配置文件的http字段中添加以下配置:

1
2
3
4
5
6
7
8
http {
......
map $http_x_forwarded_for $clientRealIp {
"" $remote_addr;
~^(?P<firstAddr>[0-9\.|:|a-f\.|:|A-F\.|:]+),?.*$ $firstAddr;
}
......
}

以上map函数解析$http_x_forwarded_for字段,当字段为空时,使用$remote_addr映射为$clientRealIp.否则使用$firstAddr映射.

同时修改json日志格式,使用$clientRealIp替代$http_x_forwarded_for

1
2
3
4
5
6
7
8
9
10
11
12
13
14
15
16
17
18
19
log_format json escape=json  '{"@timestamp":"$time_iso8601",'
'"@source":"$server_addr",'
'"hostname":"$hostname",'
'"ip":"$clientRealIp",'
'"client":"$remote_addr",'
'"request_method":"$request_method",'
'"scheme":"$scheme",'
'"domain":"$server_name",'
'"client_host":"$host",'
'"referer":"$http_referer",'
'"request":"$request_uri",'
'"args":"$args",'
'"size":$body_bytes_sent,'
'"status": $status,'
'"responsetime":$request_time,'
'"upstreamtime":"$upstream_response_time",'
'"upstreamaddr":"$upstream_addr",'
'"http_user_agent":"$http_user_agent"'
'}';

重启Nginx

1
2
sudo nginx -t
sudo nginx -s reload

再次查看日志,发现此时ip字段只保留了公网IP地址,去掉了阿里云的SLB内网地址

1
{"@timestamp":"2020-08-14T09:46:59+08:00","@source":"10.111.10.35","hostname":"iqg-new1","ip":"113.247.47.77","client":"10.111.30.194","request_method":"GET","scheme":"http","domain":"api.v4.iqianggou.com","client_host":"v4.api.iqg-new1","referer":"https://servicewechat.com/wxa36b4671d95ba753/86/page-frame.html","request":"/api/item?......}

本文标题:Filebeat+logstash收集Nginx访问日志

文章作者:Jesse

发布时间:2020年08月25日 - 22:08

最后更新:2020年08月27日 - 07:08

原始链接:https://jesse.top/2020/08/25/elk/Filebeat+logstash收集Nginx访问日志/

许可协议: 禁止商业用途 转载请保留原文链接及作者。

坚持原创技术分享,您的支持将鼓励我继续创作!